

 ITA
ITA  ENG
ENG SPAN
SPAN FR
FR NL
NL GER
GER FI
FI

 ENG
ENG  ITA
ITA Energy management: what it is, how it works, and why businesses with buildings need it
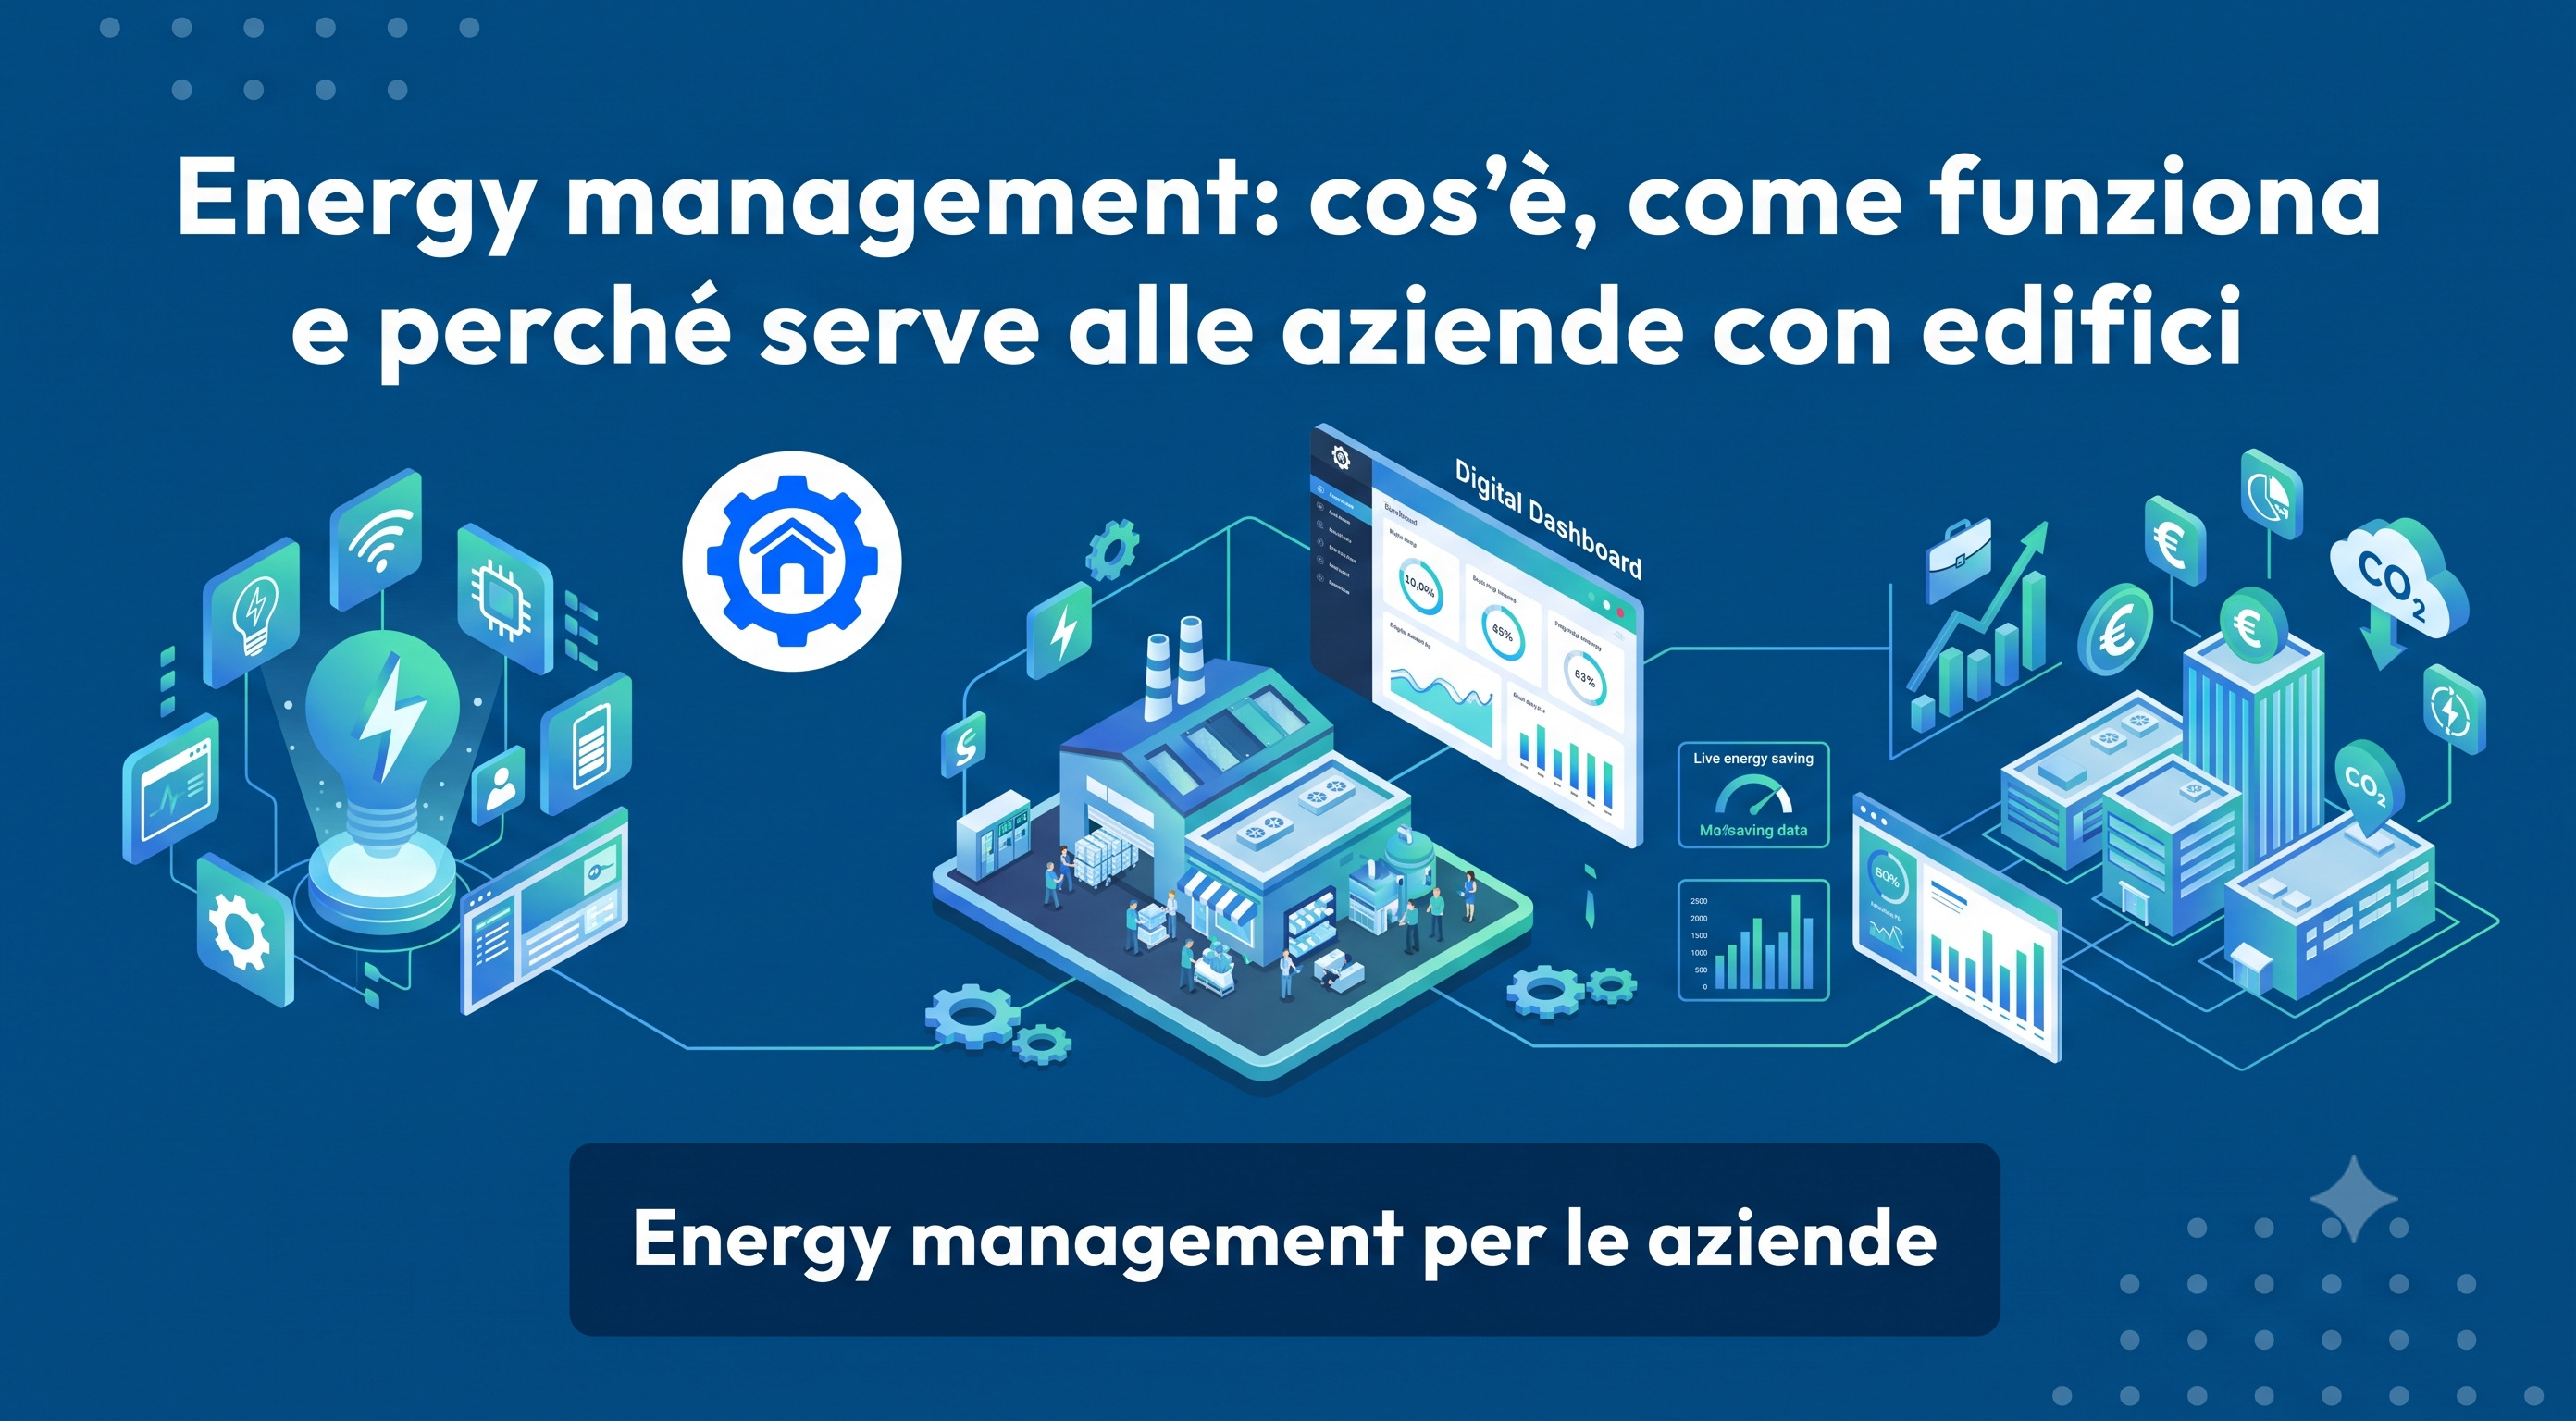
Energy management is the systematic management of energy within an organization: measuring consumption, identifying where energy is wasted, taking action, and checking whether the action has worked.
The difference from generic “energy saving” is that it is not a one-off campaign, but an ongoing process. The difference from purchasing energy is even clearer: renegotiating a contract lowers the price, while energy management reduces consumption.
In brief:
- It is a four-stage cycle: measure, analyze, act, and verify.
- It mainly concerns those who manage buildings, because that is where spending and regulatory requirements are concentrated.
- Requirements are increasing: energy audits, management systems, and building automation.
- Without measured data, the cycle stops at the second stage, and savings remain estimates.
Why it matters to building managers
Buildings are where European energy consumption is concentrated: according to the Council of the European Union, they account for 40% of final energy consumption and 36% of energy-related greenhouse gas emissions, and around 75% of the existing building stock is considered energy-inefficient.
For a company occupying offices, retail outlets, hotels, or healthcare facilities, this creates three simultaneous pressures:
- Cost. Energy is an operating expense that can be reduced without affecting business activity, unlike many other costs.
- Regulations. Mandatory audits, management systems, and building automation: requirements are expanding from industry to the tertiary sector, as shown by the EPBD directive.
- The demand for data. Tenants, investors, and customers want verifiable figures on consumption and emissions, not generic statements.
The energy management cycle
| Phase | What is done | Tools | Output |
|---|---|---|---|
| Measure | Submetering of main utilities, environmental data, and contextual data | Smart meters and IoT sensors , monitoring platform | Reliable load profiles and indicators |
| Analyze | Consumption breakdown, comparison across periods and buildings, identification of waste | Energy audit , internal benchmark | List of measures with costs and benefits |
| Act | Operational adjustments, automation, building systems, building envelope | Controls, BMS or light BMS, upgrades | Reduced consumption while maintaining the same level of service |
| Verify | Comparison with the baseline adjusted for weather and activity | IPMVP protocol, normalized indicators | Demonstrable savings and an updated baseline |
The critical point is the transition from the fourth phase back to the first: verification produces the data that updates the baseline and restarts the cycle. When this link is missing, every year starts from scratch with new estimates.
Who is responsible for it in a company
Three recurring roles, each with different responsibilities:
- The energy manager oversees the process: analyzing data, proposing measures, and being accountable for targets. In some companies, appointing one is a legal requirement. This role differs from an EGE (Energy Management Expert), which is a certification: one person can fulfil both roles, but this is not automatic.
- The facility manager oversees building operations and maintenance and puts decisions into practice on site.
- When involved, the ESCo implements measures and assumes part of the performance risk through contracts linked to the savings achieved.
In medium-sized organizations, the first two roles often overlap, and the typical problem is not a lack of expertise: energy management remains an additional task, with no dedicated time and no readily available data.
The regulatory framework in two minutes
- A mandatory energy audit every four years for large companies and energy-intensive businesses, with penalties for non-compliance. Details are available in the energy audit guide.
- Energy management systems: ISO 50001, supported by a compliant audit, currently exempts organizations from the energy audit requirement and, as the European energy efficiency directive is transposed into national law, is expected to become mandatory for companies with high energy consumption.
- Building performance: the EPBD directive introduces minimum standards for non-residential buildings, as well as requirements for solar energy and building automation.
- Voluntary certifications: LEED, BREEAM, and WELL are not mandatory, but they require the same data and affect property value.
There is one common thread: all these regulations require real, documented measurements. This is precisely where organizations most often stumble: in ENEA assessments of mandatory energy audits submitted in November 2025, around 70% of non-compliances concerned the strategy and monitoring plan. Those who genuinely measure consumption tend to meet the requirements as a consequence.
The tools: what you really need
The acronyms look similar, and confusion is common. In practice:
- EMS (Energy Management System): the platform that collects energy data, calculates indicators, and flags anomalies. We discuss it in detail in the article on EMS, which also compares platforms on the market.
- BMS (Building Management System): the system that controls and regulates building services. Monitoring and taking action are different functions, as we explain in our article on building automation.
- CMMS (Computerized Maintenance Management System): maintenance software that turns an anomaly into an assigned and tracked work order.
- Digital twin: a building model connected to real-world data that brings together the three elements above and represents the level achieved by a smart building.
You do not need all of them immediately. However, they need to work together, because separating energy, maintenance, and spaces creates most of the manual work.
How to get started in a company with multiple buildings
A sequence that works even with limited budgets:
- Inventory. List the properties with their floor areas, annual consumption by energy source, installed system capacity, and automation status. Utility bills and a few phone calls are enough.
- Ranking. Rank buildings by specific consumption per square metre. The buildings at the top of the list are where to start—not the most convenient ones.
- Pilot. One representative building, submetering of the main utilities, and a few weeks of data recorded at 15-minute intervals.
- Quick wins. Adjust operating schedules, setpoints, and loads running in empty buildings: near-zero-cost measures that help fund the rest, as described in the building energy efficiency guide.
- Rollout. Replicate the approach across other properties using the same naming conventions and indicators so they can be compared.
Starting with a pilot is not simply a cautious approach: it is a way to obtain real figures to present to budget decision-makers, rather than promises.
Energy management by type of organization
The process is the same, but the starting point changes:
- Company with a single headquarters: work in depth on one building, with detailed submetering and occupancy-based controls. Further reading: how to reduce office energy consumption.
- Multi-site network (retail, branches): the value lies in comparing similar sites and replicating adjustments across dozens of locations. Further reading: retail and shopping centers.
- Hospitality and healthcare facilities: comfort and operational continuity are essential, so the focus is on controls and maintenance rather than invasive interventions. Further reading: hotels and hospitals and care homes.
- Schools and public buildings: intermittent and highly predictable use, with significant opportunities to optimize schedules and access dedicated funding. Further reading: schools and public buildings.
- Logistics and data centers: a small number of systems operating continuously, where the hourly consumption profile matters more than installed capacity. Further reading: warehouses and logistics, data centers.
- Industry: production processes matter more than buildings, and indicators are calculated per unit produced.
How to present an energy plan to management
This is where many projects stall, and rarely for technical reasons. Four elements make a proposal defensible:
- A baseline, not a promise. Measured consumption over the previous twelve months, normalized for weather and activity. This is the figure against which results will be measured.
- Measures ranked by payback period. Start with near-zero-cost measures that fund subsequent ones, then move on to systems and the building envelope. For larger investments, the hyper-depreciation incentive under the Transition 5.0 Plan may also be relevant.
- The risk of doing nothing. Upcoming regulatory requirements, exposure to energy prices, and properties becoming less attractive to tenants with sustainability commitments.
- How results will be verified. Stating in advance how savings will be measured leaves less room for disputes later and distinguishes a technical proposal from a sales pitch.
The mistakes we see most often
- Starting with interventions. Buying technology before knowing where energy is consumed almost always means optimizing the wrong thing.
- Measuring without taking action. The opposite mistake is just as common: dashboards are running, but nobody acts on the results. The gap is documented: mandatory audits submitted to ENEA in 2025 reported approximately 29.7 ktoe of annual savings already achieved, compared with approximately 68.2 ktoe identified, meaning less than half of the identified potential resulted in action.
- Comparisons that are not normalized. Year-on-year comparisons that ignore weather, schedules, and occupancy are guaranteed to produce incorrect conclusions.
- Separating energy and maintenance. Poorly maintained systems consume more energy, and organizations that manage these areas in separate systems notice the problem too late: this is where predictive maintenance comes in.
- No one is accountable. Without someone who has dedicated time and a clear mandate, the process stops as soon as the first operational emergency arises.
UTwin tools
UTwin’s energy management software covers the entire cycle on a single platform: the supply of smart meters and IoT sensors for energy, water, gas, and environmental parameters; cloud-based data collection and historical storage; and visualization on the building’s BIM model or floor plan.
AI algorithms identify anomalies and remotely adjust building systems based on outdoor weather and space occupancy, while the natively integrated maintenance software (CMMS) completes the cycle: an anomaly becomes an assigned and tracked work order, providing the evidence needed for energy audits, assessments, and certifications.
Where a building already has a BMS, the platform integrates with it and enhances its remote automation capabilities. Where a traditional BMS would not pay for itself, such as in retail outlets, supermarkets, hotels, care homes, and small premises, it works as a light BMS with CAPEX up to 70% lower than market systems.
For industrial settings, a dedicated approach is covered in the article on energy management and industry, while those working with information models can explore the BIM-based energy management software.
Frequently asked questions
- What is the difference between energy management and energy efficiency?
Energy efficiency is the result: consuming less energy while maintaining the same level of service. Energy management is the process that achieves this and sustains it over time through measurement, analysis, action, and verification.
- Is software needed for energy management?
For a single building, you can start with utility bills and a spreadsheet. For multiple buildings, or when data is needed for regulatory obligations and certifications, a platform becomes necessary—not so much to collect data as to keep it comparable over time and across sites.
- How long does it take to see the first results?
It depends on what is meant by results. A few weeks of data recorded at 15-minute intervals for one building are enough to obtain the first reliable picture: this is the time needed to identify overnight consumption, consumption on closed days, and peaks outside operating hours.
Adjustments to schedules and setpoints can produce results during the current season. Proper verification, however, requires a period that can be compared with the baseline and normalized for weather and activity. This is what turns apparent savings into demonstrable savings. - How much can be saved with an energy management system?
It depends on the starting point. The areas that consistently deliver the greatest returns are the same: system operating schedules, loads running in empty buildings, and controls based on outdoor temperature and occupancy. The only reliable way to estimate the potential is to measure current consumption.
- Is energy management mandatory?
The process itself is not mandatory, but several of its elements are: energy audits for large companies and energy-intensive businesses, appointing an energy manager above certain consumption thresholds, and building automation systems for non-residential buildings above specified power thresholds.
- Who should be responsible for it in a medium-sized company?
Usually, the facility manager or technical manager, supported by an external EGE (Energy Management Expert) for audits and certifications. What makes the difference is not the role selected, but whether that person has dedicated time and access to the data.
Where to start
The first step requires no budget: put the buildings in a table with their floor area, annual consumption, and consumption per square metre. That ranking already shows where to start.
The second step is to measure the building at the top of the list in enough detail to see what happens at night and on closed days. From there, the cycle can sustain itself.


Informative Material