

 ITA
ITA  ENG
ENG SPAN
SPAN FR
FR NL
NL GER
GER FI
FI

 ENG
ENG  ITA
ITA Energy management in retail stores: multi-site consumption under control from a single platform
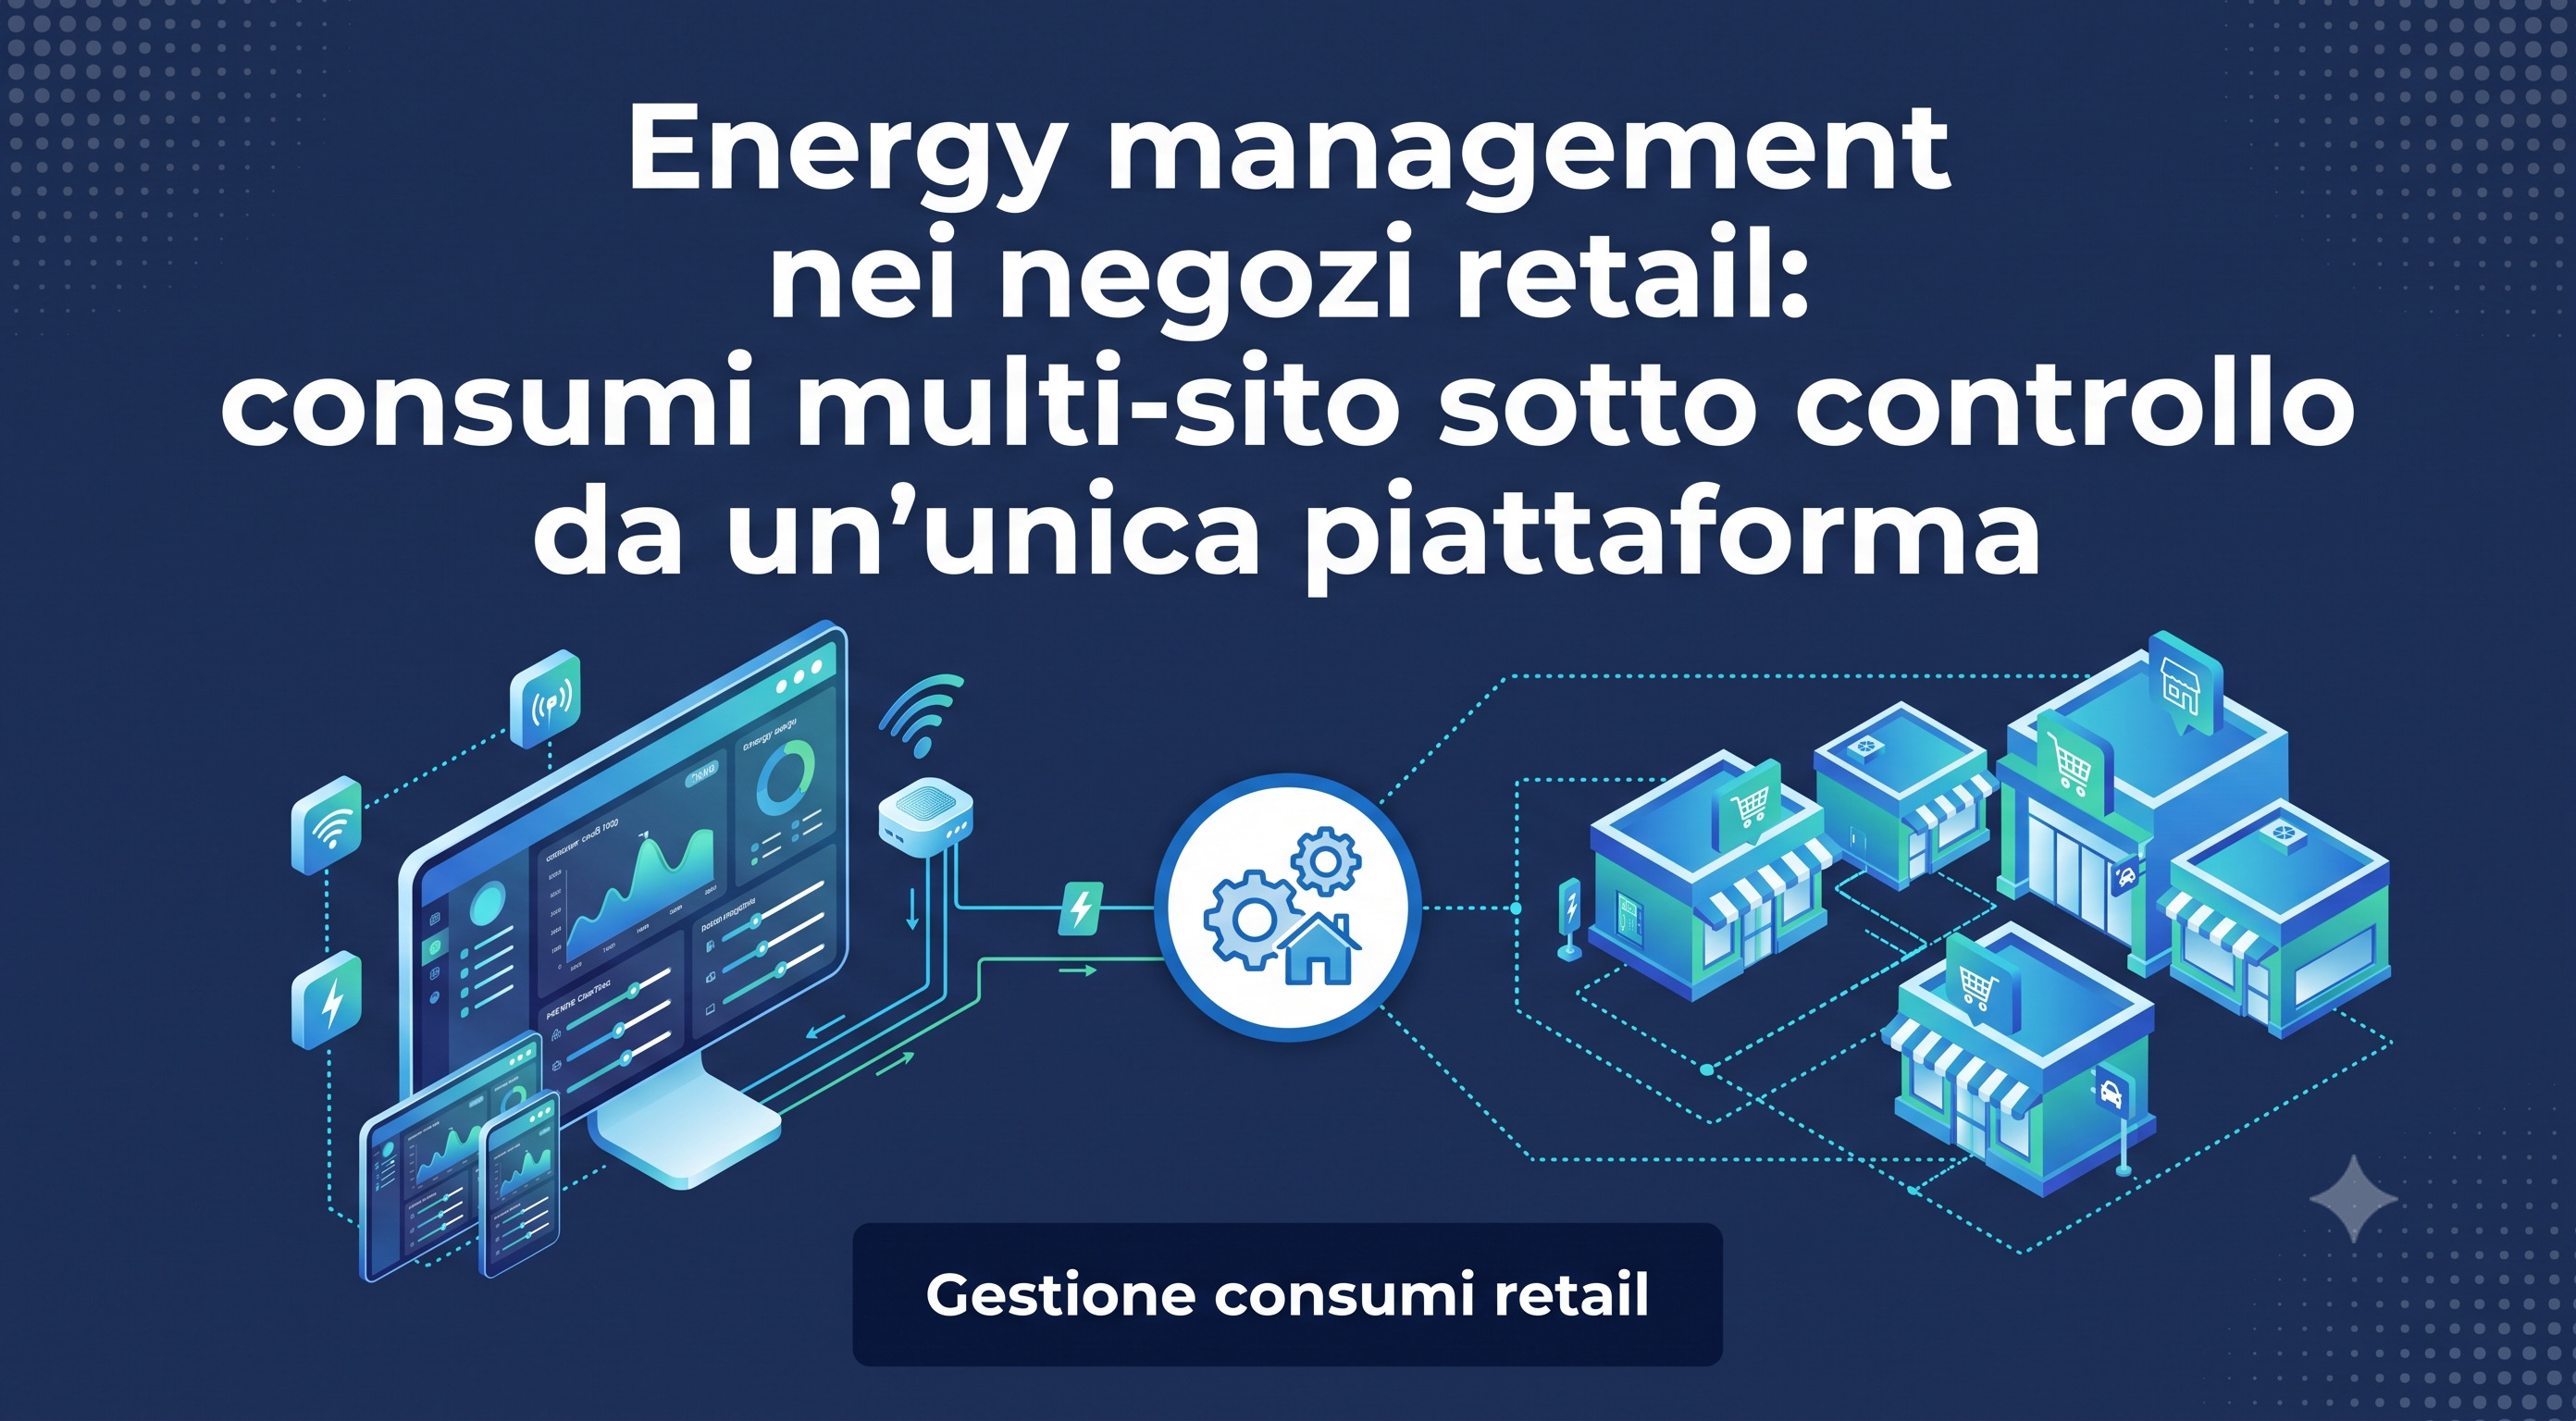
In retail, the energy problem is rarely an individual store: it is that there are many stores, they are similar, and nobody can say which one is consuming more than it should.
This is also the sector's opportunity. When dozens of stores with the same format are managed, every improvement identified in one can be applied to all the others, multiplying the return by the number of locations.
In brief:
- In large-scale food retail, refrigeration is the largest energy consumer, accounting for an indicative 35–45%.
- Comparing similar stores is the fastest analysis tool available.
- For food refrigeration, energy consumption and product safety are monitored using the same sensors.
- The biggest challenge is organisational: understanding who decides and who pays at each store.
Where a retail store consumes energy
Energy consumption varies considerably between a clothing store and a supermarket, but the main categories remain the same: refrigeration, lighting, air conditioning and, in food retail, in-store preparation areas such as bakeries, delicatessens and butcher shops.
Sector guidelines developed by ENEA and Federdistribuzione for energy audits in large-scale retail indicate an approximate breakdown: 35–45% for food refrigeration, 20–30% for lighting and 10–18% for air conditioning. This concentration simplifies the task: the starting point is clear and concerns systems that operate continuously.
In non-food retail, lighting and air conditioning account for a larger share, with one particularity: shop windows and signs often remain illuminated well beyond opening hours.
The real retail challenge: many similar sites
For a single building, load profiles are analysed. For a network of stores, there is a faster approach: compare the stores with one another.
Two stores with the same floor area, format and opening hours but different consumption levels raise a question with a specific answer. The cause may be a poorly calibrated system, overly frequent defrosting, a door left open or a schedule that was never updated after a management change.
For the comparison to work, two conditions are necessary:
- Use common terminology across sites: if each store names its utilities differently, the data cannot be compared. This must be decided at the beginning because nobody will rename everything afterwards.
- Use normalised indicators: consumption per square metre and per opening hour, not absolute consumption; otherwise, larger stores will always appear to be the worst performers.
The five recurring sources of waste
- Open refrigerated display cases. Open cabinets and wall-mounted cases without doors or night covers continuously lose cold air, forcing the air conditioning to compensate.
- Unoptimised defrosting. Cycles set during commissioning and never reviewed, often running more frequently than necessary.
- Air conditioning fighting open doors. In summer, cooling operates at full capacity while the entrance remains wide open: this is one of the most visible and recurring problems.
- Signs, shop windows and outdoor lighting left on after hours. Timers configured only once that do not adapt to the seasons or changes in shopping centre opening hours.
- Systems running before and after actual opening hours. Systems switched on hours too early and not switched off when they should be, especially where controls are local and manual.
What to measure
| What | Why | Useful indicator |
|---|---|---|
| Electricity consumption per store | The basis for comparing stores | kWh per square metre and per opening hour |
| Sub-metering by utility | Separates refrigeration, lighting and air conditioning | Share of each utility in the store's total consumption |
| Temperatures of display cases and cold rooms | Energy consumption and food safety are measured together | Temperature for each display case, with thresholds and alerts |
| Base consumption when the store is closed | Shows what remains switched on at night | Average kW during closing hours |
| Indoor conditions | Checks that savings do not worsen customer and staff comfort | Temperature and humidity in the sales area |
The instrumentation is the same as that described in the guide to smart meters and IoT sensors, with dedicated probes on display cases and cold rooms.
Food refrigeration: energy and safety monitored by the same sensors
This is the specific feature that makes monitoring easier to approve in a food retail chain. Display-case temperatures must be checked anyway to meet food safety requirements and prevent stock losses.
The same sensors that record these temperatures also reveal whether a system is operating poorly: a display case struggling to maintain its setpoint, an excessively long defrost cycle or a compressor starting more frequently than usual are signs of excess consumption even before they indicate a risk to the products.
An alert received in time for a cold room can prevent three things at once: abnormal energy consumption, stock losses and non-compliance. This is a case where return on investment is measured in more than just kWh.
The measures that deliver results fastest
- Night covers and doors on refrigerated display cases, where missing: this offers one of the best cost-to-benefit ratios in food retail.
- Review defrosting cycles using real data instead of default settings.
- Align schedules and setpoints with actual opening hours, using centralised management instead of adjusting each store individually.
- LED lighting with controls, particularly for shop windows, signs and outdoor areas.
- Recover heat from refrigeration systems to produce hot water or provide heating, where the system configuration allows it.
The prioritisation principle is the one described in the guide to energy efficiency improvements: first correct operating practices, then make changes to the systems.
The organisational challenge: who decides and who pays
In retail, the main limitation is rarely technical. A store may be leased, located in a shopping centre with shared systems, operated as a franchise or managed directly: in each arrangement, who decides on the intervention and who benefits from it will differ.
Two precautions can help:
- Separate data by responsibility. Knowing how much the sales area consumes compared with the shopping centre's shared systems helps avoid disputes over recharges.
- Give store managers simple data. Comparing a store with similar stores is more effective than sending a circular about opening hours, because nobody wants to finish last in the ranking.
For stores located inside shopping malls, the content on shopping centres is also relevant, as shared systems follow their own operating principles.
The tools
An individual store does not have a BMS and never will: the cost of a wired system cannot be justified for just a few hundred square metres. But a chain of fifty stores needs the same level of control as a large building, spread across fifty addresses. The complete process, from measurement to verification of savings, is described in the energy management guide.
This is the context in which UTwin's energy management software operates: smart meters and IoT sensors supplied with the platform, data collected in the cloud from all sites, comparisons between stores, anomaly alerts and remote system adjustments based on outdoor weather and occupancy.
The integrated maintenance software (CMMS) turns an anomaly into a work order assigned to the area maintenance technician, with a history for each store. This approach is described in the content on retail store and supermarket maintenance, applied to energy management.
For stores, supermarkets and small premises, the platform works as a light BMS, with CAPEX up to 70% lower than traditional systems: these are the types of buildings where the cost difference is most significant.
Frequently asked questions
- What is the largest energy consumer in a supermarket?
Food refrigeration. ENEA and Federdistribuzione guidelines for energy audits in large-scale retail place it at 35–45% of consumption, ahead of lighting (20–30%) and air conditioning (10–18%), with in-store preparation areas also contributing in facilities that have them.
- How do you compare stores of different sizes?
Use normalised figures: consumption per square metre and per opening hour, comparing stores with the same format and in the same climate zone. Comparing absolute consumption always puts the largest stores at the bottom of the ranking and provides no useful insight.
- Does every store need a different system?
No, and that is the point. Chains benefit precisely from standardisation: the same instrumentation, the same terminology and the same indicators. This means that an improvement identified in one store can be applied to the others without repeating the analysis.
- Is monitoring refrigerated display cases only useful for saving energy?
No, and that is why it is approved first in many chains. The same measurements support food safety, prevent stock losses and document storage conditions.
Where to start
The first step for a network of stores is not to install sensors everywhere: it is to rank annual consumption by store, divided by floor area, and examine the stores at the top of the list. In almost every case, the three or four highest-consuming stores have a specific problem, and that problem is repeated at other locations in the network.


Informative Material