

 ITA
ITA  ENG
ENG SPAN
SPAN FR
FR NL
NL GER
GER FI
FI

 ENG
ENG  ITA
ITA Building monitoring: energy and water consumption, gas usage and environmental parameters
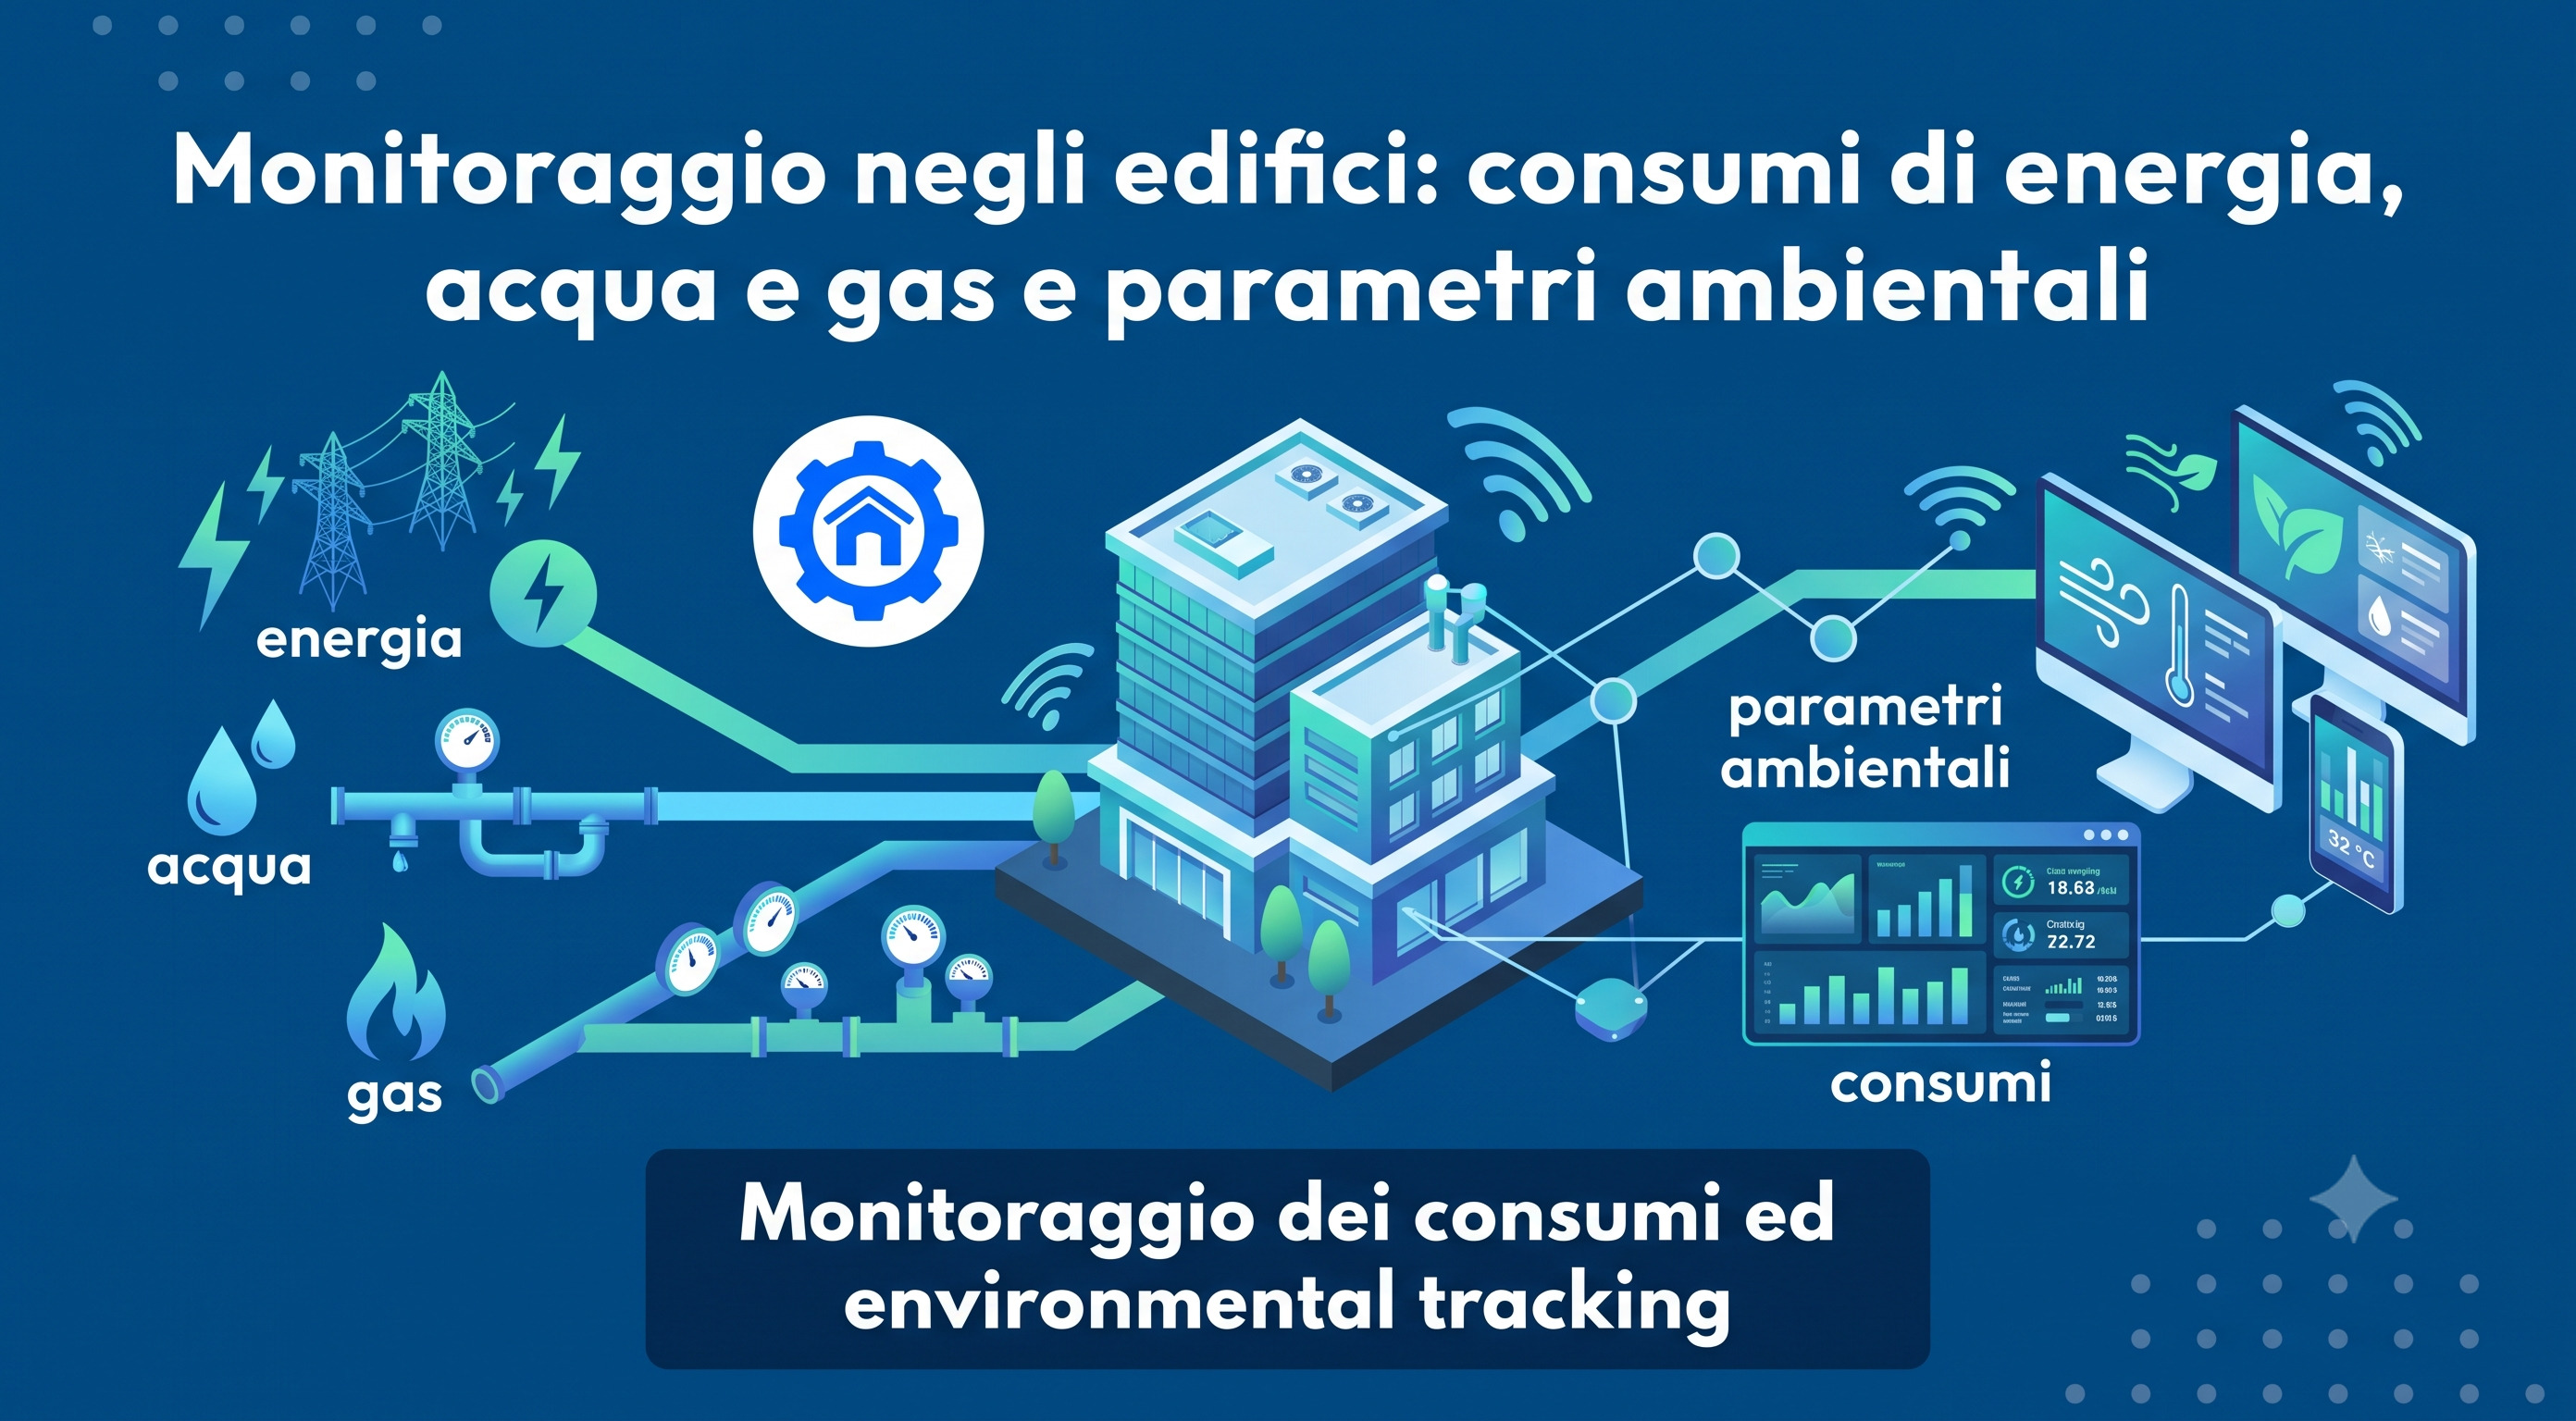
Monitoring a building means continuously measuring its consumption and comparing it with a reference to understand whether what is happening is normal or not.
That is the key difference compared with reading utility bills. A bill tells you how much you spent last month; monitoring tells you which system consumed energy, when it did so, and whether that consumption was justified by the conditions on that day.
In brief:
- There are four flows to monitor: electricity, thermal energy and gas, water, and environmental parameters.
- A few well-chosen indicators are more valuable than a dashboard with fifty charts.
- Consumption must always be normalised against the relevant conditions: weather, opening hours and occupancy.
- Monitoring produces savings only if someone receives the alerts and has the authority to take action.
What is monitored in a building
The four flows are those we described when discussing smart meters and IoT sensors: electricity, thermal energy and gas, water, and environmental conditions.
The practical rule for deciding where to place measurement points is simple: start with the utilities that account for the largest share of the bill and the areas where known problems exist, rather than mapping the entire building. A well-monitored HVAC system is worth more than twenty measurement points distributed at random.
Useful granularity starts at 15-minute intervals. This frequency makes it possible to read load profiles and distinguish normal operating consumption from waste.
The indicators that matter
| Indicator | What it measures | What it is used for | Caution |
|---|---|---|---|
| Specific consumption (kWh/m² per year) | Energy per unit of floor area | Compare different buildings and assess performance across the portfolio | Must be calculated using comparable floor areas; otherwise, the comparison is invalid |
| Nighttime baseload | Power drawn while the building is closed | Identify loads that are never switched off; these are the first to reduce | Depends on which systems must remain active and must be defined for each case |
| Share of consumption outside opening hours | Percentage of consumption while the building is closed | Quantify operational waste with a single figure | Actual opening hours are needed, not theoretical ones |
| Consumption per unit of activity | kWh per opening hour, per occupant or per occupied room | Compare periods with different levels of activity | The unit must be selected once and kept consistent over time |
| Peak power and load factor | Maximum power demand and its ratio to the average | Avoid exceeding contracted power and understand load simultaneity | A single peak can cost more than many hours of average consumption |
| Consumption normalised by degree days | Thermal energy adjusted for weather effects | Determine whether savings result from interventions or from a mild winter | Requires a sufficiently long historical data series |
| Nighttime water consumption | Minimum nighttime flow rate | Detect hidden leaks | Must be distinguished from legitimate nighttime uses, such as irrigation or laundry |
| CO2, temperature and humidity | Indoor conditions | Ensure that savings are not achieved at the expense of comfort | Depend on sensor placement |
Normalisation: degree days and relevant variables
This is the step that turns data into information. January's thermal consumption cannot simply be compared with January of the previous year: it depends on how cold the weather was.
Degree days are the standard tool for accounting for this. Italian Presidential Decree DPR 412/93 defines them as the sum, over all days in the conventional heating period, of the positive differences between the reference indoor temperature of 20 degrees and the average daily outdoor temperature.
On the same basis, Italy is divided into six climate zones, from A (below 600 degree days) to F (above 3,000).
In practice, thermal consumption is related to the degree days for the period, typically using linear regression, and consumption is compared under equivalent climatic conditions.
The same reasoning applies to other variables: opening hours, occupancy and activity volumes. The useful distinction is between relevant variables, which change regularly and must be included in the model, and static factors, such as floor area or number of floors, which rarely change but require the baseline to be updated when they do.
This also explains the most common paradox: an indicator improves while the bill increases. The indicator measures energy; the bill also includes the price. They are different things and must be considered together.
How to read a load profile
The daily load profile is the most informative document a building produces. There are four things to examine, in order:
- The nighttime baseline. How much energy does the building use when nobody is there? It is the starting point for any efficiency measure because this consumption can almost always be reduced.
- The start-up ramp. At what time do systems switch on compared with opening time? A two-hour early start repeated every day adds up to much more than it might seem over a year.
- The daytime plateau. Consumption during operating hours, to be compared with occupancy and outdoor temperature.
- Shutdown. When does the building return to its baseline, and does it actually return? Evening consumption tails are among the most common findings.
In our experience, the first month of data from a building that has never been monitored almost always reveals at least one issue of this kind, and it is rarely a fault: it is usually a schedule that nobody has updated for a long time.
Water and gas: what changes
For water, the main indicator is nighttime consumption. In a closed building, a constant flow overnight is almost always a leak, and continuous monitoring detects it within days rather than waiting for utility bills. Hotels have their own specific considerations, which we explore in our content on water monitoring in hospitality facilities.
For gas and thermal energy, monitoring is mainly used to assess efficiency: how much energy enters the plant room, how much reaches the different zones, how many hours the generators operate and under what conditions. These are the data that make predictive maintenance useful, because a gradual decline in performance becomes visible well before a breakdown.
Monitoring a portfolio of buildings
In a single building, monitoring helps identify waste. Across twenty buildings, it serves another purpose that is often even more valuable: identifying which buildings are outliers compared with the others.
When several similar sites are available, internal comparison becomes one of the fastest analysis methods. If two retail outlets with the same floor area, opening hours and format consume different amounts of energy, that is a question worth investigating, and the answer can be found without external industry benchmarks.
Three precautions are needed for this to work:
- A common naming convention. If each site names its utilities differently, comparisons cannot be made. This must be agreed at the beginning because renaming everything afterwards is work that nobody does.
- Normalised indicators. Comparisons are meaningful only per unit of floor area, opening hour or activity, and within the same climate zone.
- An up-to-date ranking. Ranking buildings by specific consumption and examining those at the top is the most efficient way to allocate time and budget.
The same reasoning applies by sector: offices, schools and shopping centres have different typical profiles, and comparisons are meaningful within each category.
From dashboards to alerts
A dashboard that nobody opens is a cost. Monitoring generates savings when data become signals and those signals reach someone who can take action.
- Alerts based on deviations, not fixed thresholds. A fixed threshold triggers constantly in winter and never in summer. A useful alert compares consumption with what is expected under those conditions.
- A few well-calibrated rules. A system that sends twenty notifications a day will be silenced within a week.
- A recipient for every alert. If it is unclear who should act, the notification remains on the dashboard.
- Verification after the intervention. The cycle is complete only when consumption is checked to see whether it has returned to normal.
This is why monitoring works best when it is connected to maintenance: an anomaly becomes an assigned task, with a date and a recorded outcome.
The mistakes we see most often
- Too much granularity too soon. Hundreds of points on day one produce unreadable charts and no decisions.
- Unnormalised data. Year-on-year comparisons that ignore weather and occupancy lead to incorrect conclusions in both directions.
- No data owner. If monitoring is nobody's responsibility, nobody will look at it after three months.
- Gaps in historical data. Offline sensors and flat batteries undermine the baseline used to demonstrate savings, and these gaps are always discovered when the data are needed.
- Measuring without taking action. This is the most expensive mistake: a monitoring system pays for itself through corrective actions, not through measurement alone.
The tools: the monitoring platform
For one building, a spreadsheet may be enough to get started. For a property portfolio, a platform is needed because the task is not simply to read data, but to keep them comparable across different sites and over time using consistent terminology.
UTwin's energy management software is built for this purpose: it collects data from smart meters and IoT sensors for energy, water, gas and environmental parameters, stores historical data in the cloud, and displays them on the BIM model or building floor plan.
UTwin's energy management software is built for this purpose: it collects data from smart meters and IoT sensors for energy, water, gas and environmental parameters, stores historical data in the cloud, and displays them on the BIM model or building floor plan.
The maintenance software (CMMS) is natively integrated, so a detected anomaly becomes an assigned and tracked task. Where a building already has a BMS, the platform integrates with it and enhances its automation; where a traditional BMS would not be cost-effective, it works as a light BMS, with CAPEX up to 70% lower.
For a comparison of solutions available on the market, we have prepared an overview of energy management software. For more on the difference between monitoring and an energy management system, see our in-depth article on the EMS.
Frequently asked questions
- What is the difference between monitoring and an energy audit?
An energy audit is a periodic analysis that provides a snapshot of consumption and identifies possible measures. Monitoring is continuous: it verifies that measures are working and detects anomalies as they occur. An energy audit is carried out every few years; monitoring never stops.
- Which indicators are needed to get started?
Three indicators are enough to get started: energy consumption per square metre, the share consumed while the building is closed, and thermal consumption normalised by degree days. They cover, respectively, comparisons between buildings, operational waste and the effect of weather.
- How often should the data be reviewed?
For electricity consumption, 15-minute intervals are useful and are also the interval provided for in the advanced metering credits of environmental certifications. For water and gas, hourly readings are generally sufficient, while environmental parameters are updated more frequently when needed for control.
- Is monitoring also useful for ISO 50001 certification?
Yes. ISO 50001 requires a data collection plan and the calculation of performance indicators. An active monitoring system covers both requirements and reduces the workload for each audit.
- How long does it take to see the first results?
The first findings usually emerge within the first few weeks because they concern schedules and nighttime loads and do not require investment. To assess annual savings against a reliable baseline, however, at least one full season of data is needed.
Where to start
Start with one building and a few utilities: the largest energy consumer, lighting and the heating plant. Then examine the load profile over two weeks, paying particular attention to nights and weekends.
The results of this first comparison already show where the potential lies, and almost always do so before any investment is made.


Informative Material